Prometheus + Grafana指标监控
Prometheus 对大数据组件HDFS的指标进行采集,Grafana进行可视化展示。
1.Prometheus
下载
Prometheus安装包。wget https://github.com/prometheus/prometheus/releases/download/v2.45.0/prometheus-2.45.0.linux-amd64.tar.gz # 页面下载地址 https://prometheus.io/download/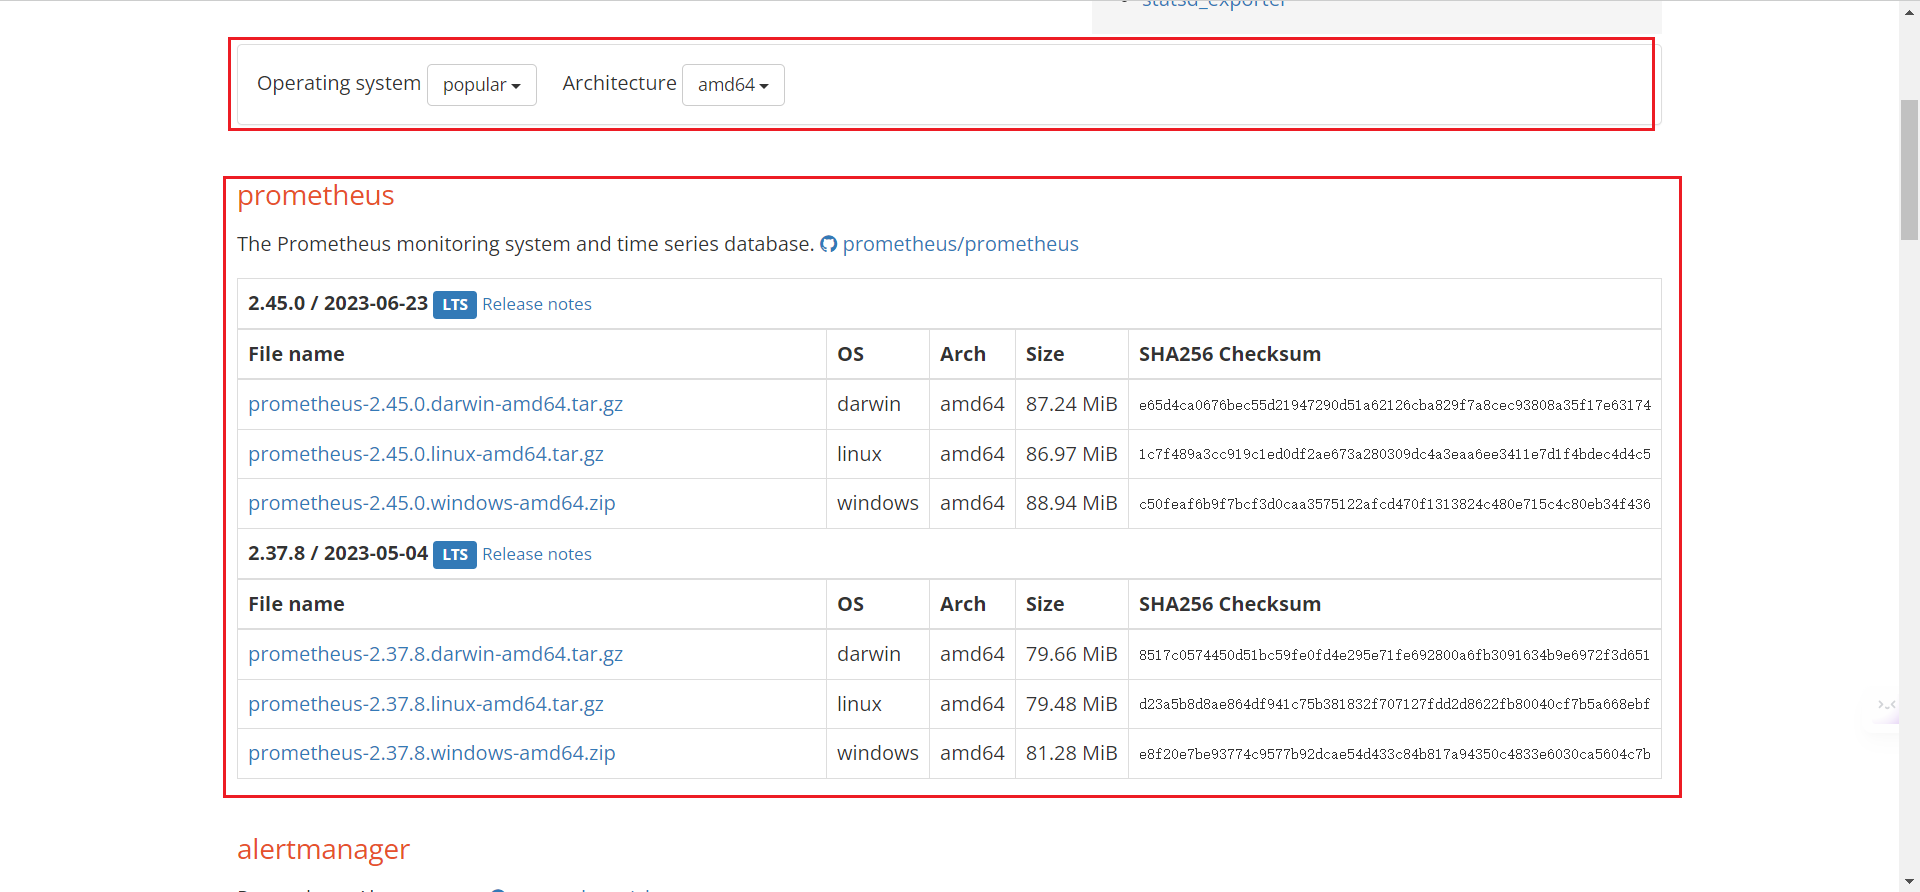
上传
Prometheus到规划的路径并进行解压。tar -zxvf prometheus-2.37.8.linux-amd64.tar.gz启动
Prometheus服务。# 需要在 Prometheus 目录下执行如下操作 ./prometheus --config.file=prometheus.yml # 建议后台启动,命令如下 nohup ./prometheus --config.file=prometheus.yml >> prometheus.log 2>&1 &启动后,即可在页面访问
Prometheus服务。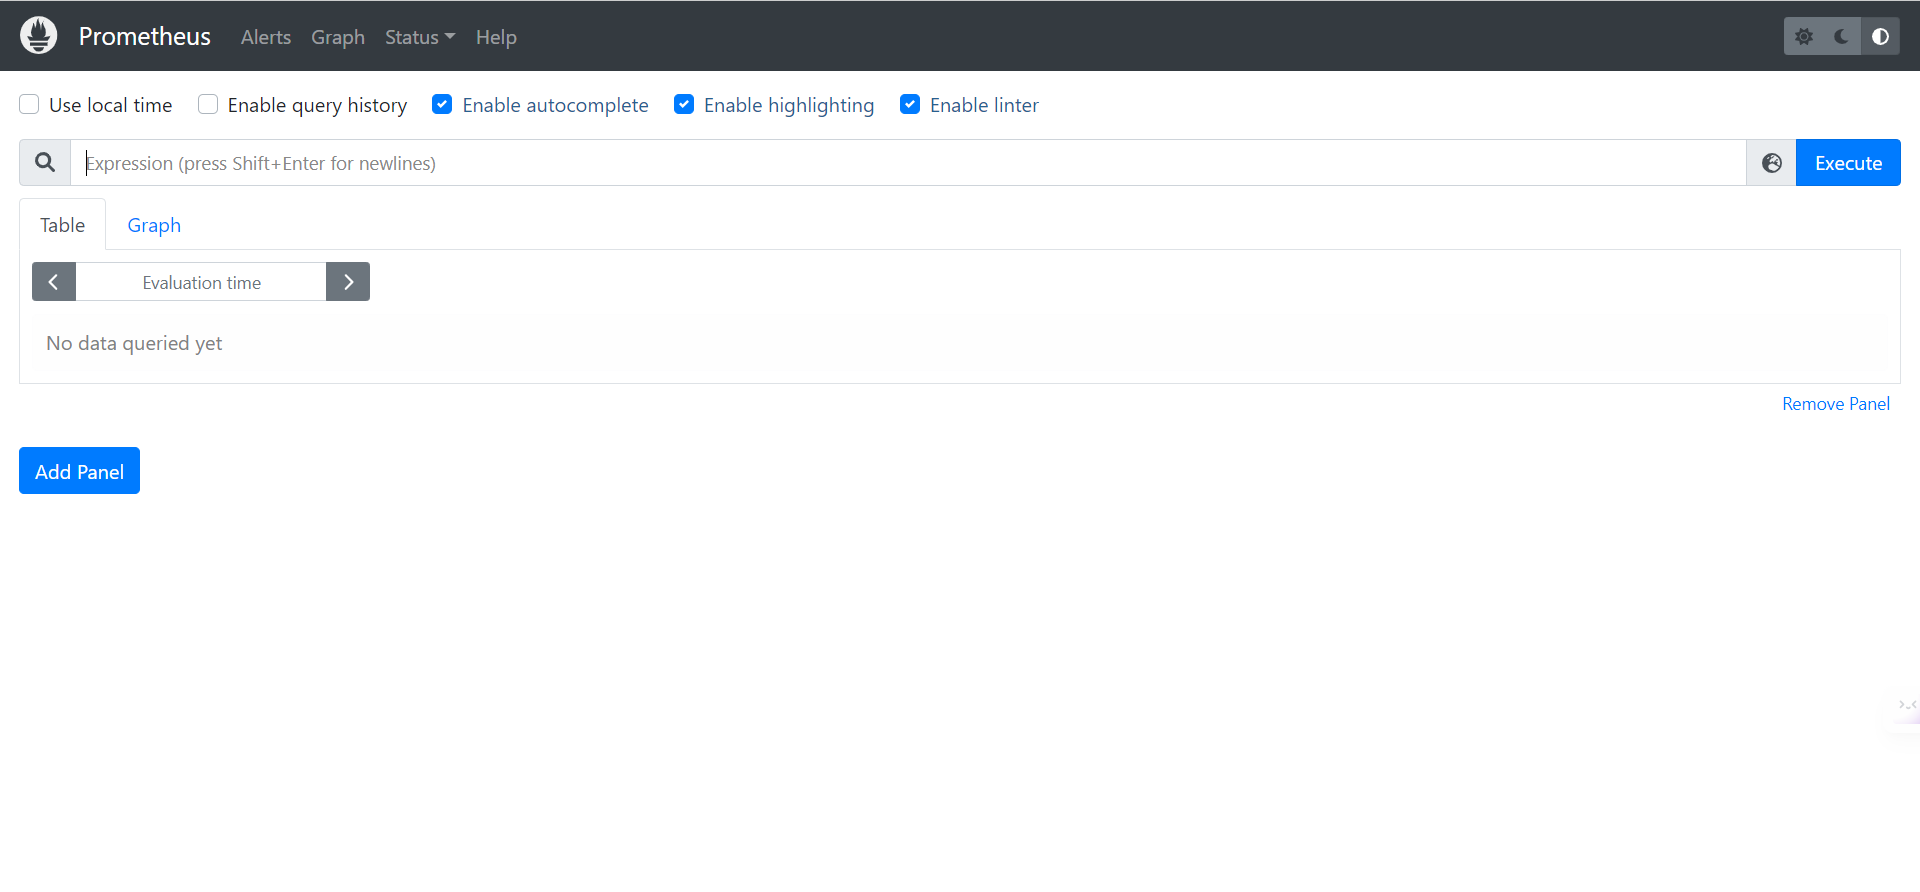
2.Grafana
下载
Grafana安装包。# 这里下载的是安装包,注意不要下载源码包 wget https://dl.grafana.com/enterprise/release/grafana-enterprise-9.5.2.linux-amd64.tar.gz # 页面下载地址 https://grafana.com/grafana/download/10.0.0?pg=oss-graf&plcmt=hero-btn-1
上传到主机规划的目录并进行解压。
tar -zxvf grafana-enterprise-9.5.2.linux-amd64.tar.gz启动
Grafana服务。# 需要在 Grafana 目录下执行如下操作 ./bin/grafana-server web # 建议后台启动,命令如下 nohup ./grafana-server web 2>&1 >> /e3base/apps/grafana/logs/grafana.log &启动后,即可在页面访问
Grafana服务。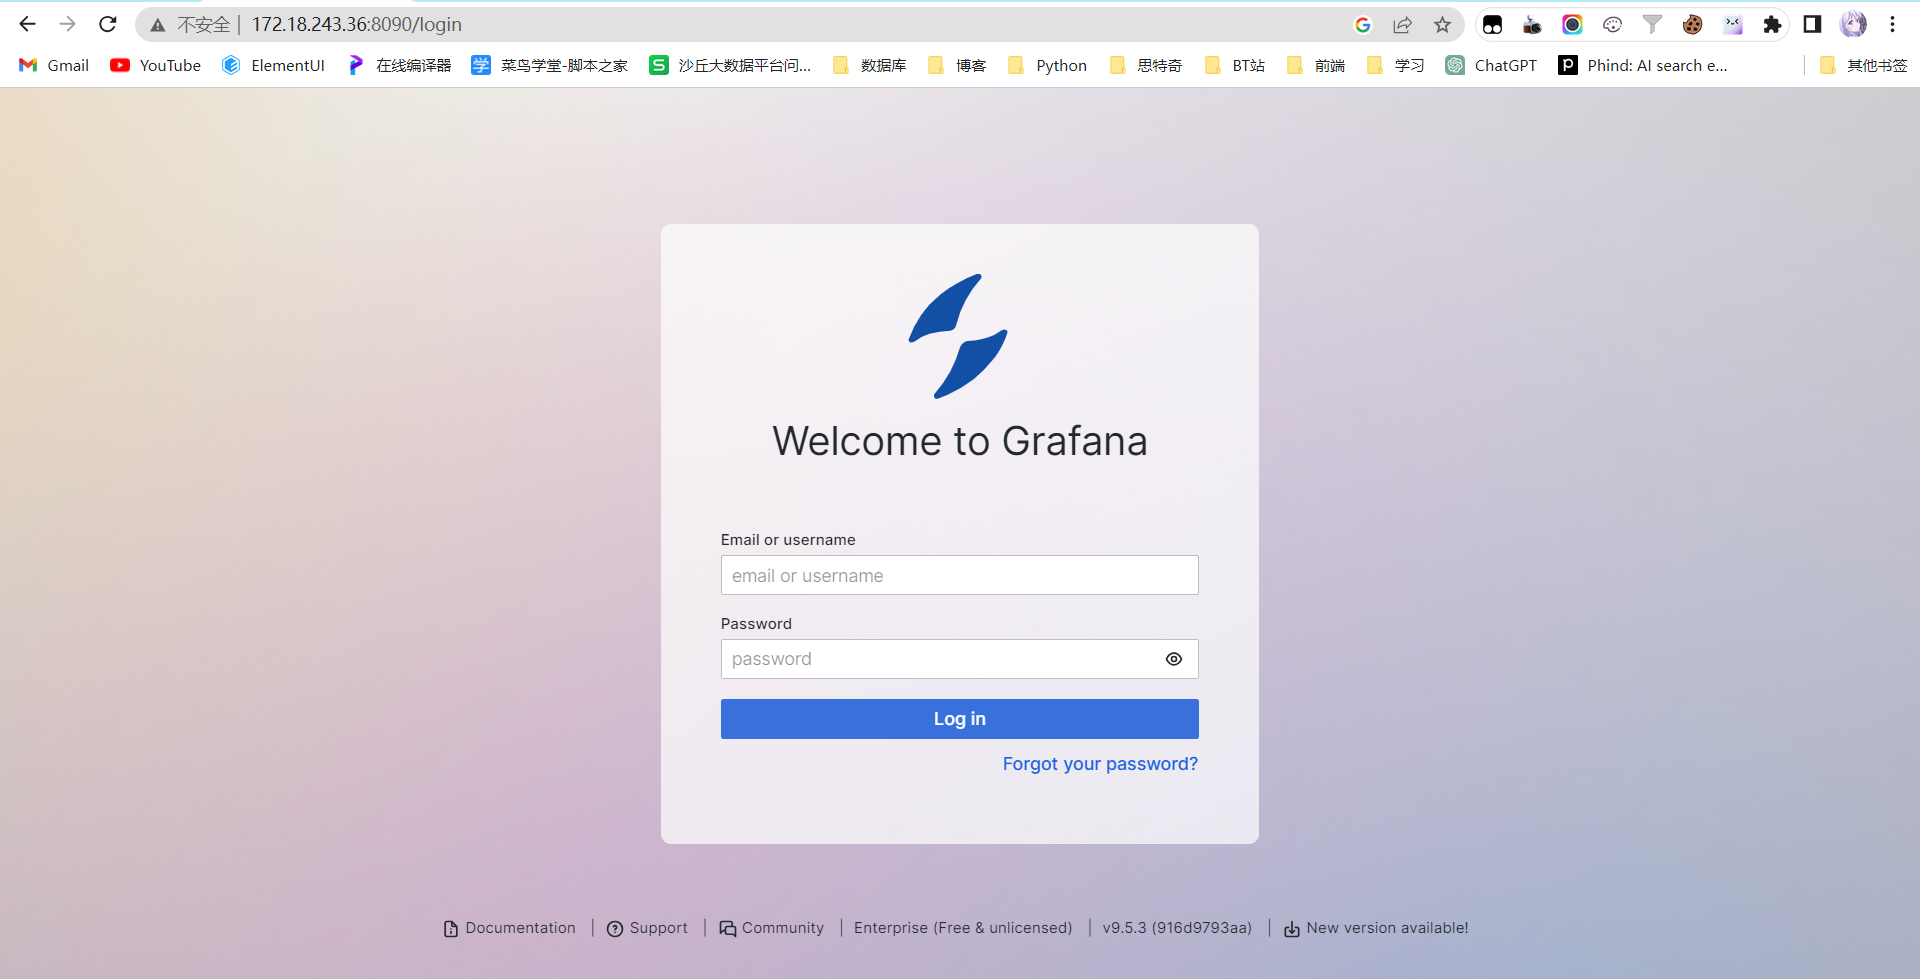
3.指标监控
3.1 HDFS
3.1.1 NameNode
环境信息
# jmx端口
12003
# NameNode节点
host-172-18-243-34
host-172-18-243-35
# 环境
Kerberos
jmx 接口测试
curl -X GET --negotiate -u e3base:e3base -i http://host-172-18-243-34:12003/jmx
curl -X GET --negotiate -u e3base:e3base -i http://host-172-18-243-35:12003/jmx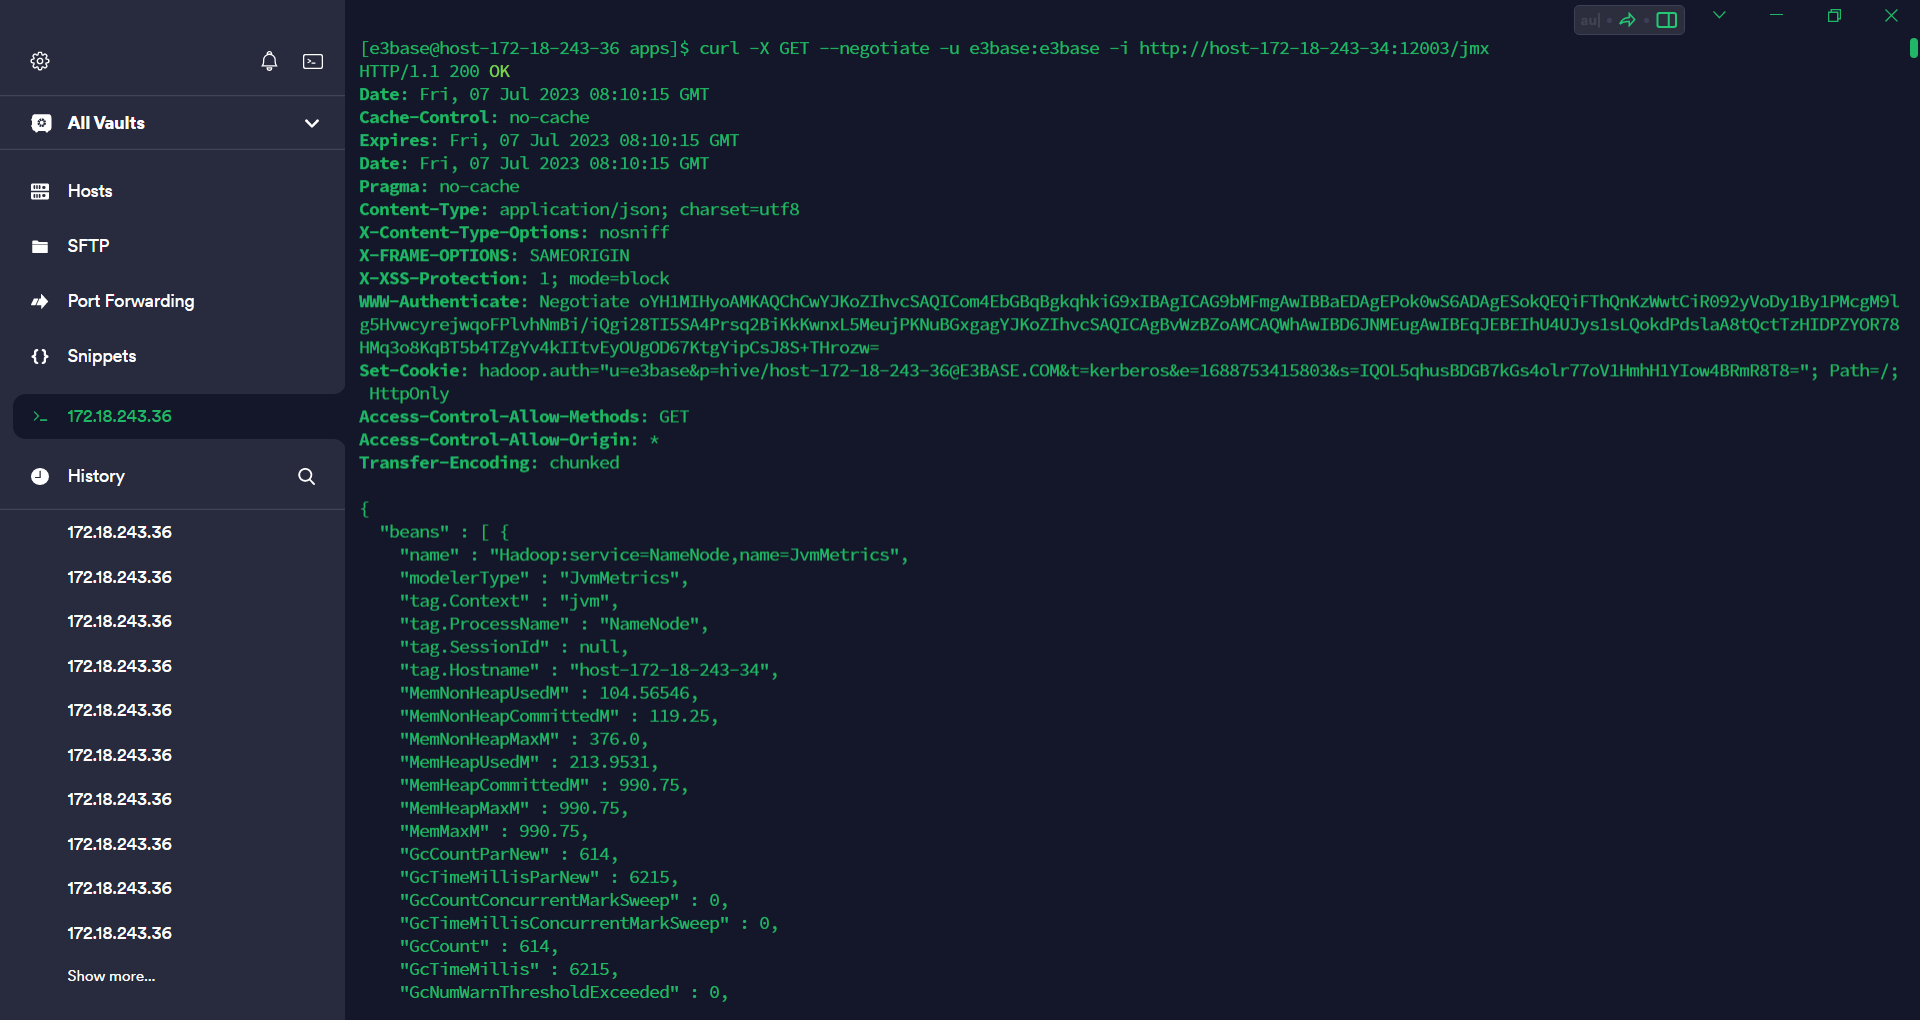
Kerberos代理
Prometheus 只能够采集非 Kerberos 环境的信息,Kerberos 环境下需要使用如下方法,将 Kerbeors 页面代理成非 Kerberos 页面供 Prometheus 进行数据采集。
解压附件中的
http_exporter.zip文件。unzip http_exporter.zip修改
httpjmx.yml配置文件,设置代理信息。httpTimeout: 10 httpUrl: - "namenode|http://host-172-18-243-34:12003/jmx" blacklistObjectNames: - "Hadoop:service=NameNode,name=NameNodeInfo|LiveNodes|DeadNodes" - "Hadoop:service=NameNode,name=FSNamesystemState|TopUserOpCounts" - "Hadoop:service=DataNode,name=DataNodeInfo|DatanodeNetworkCounts" wightlistObjectNames: - "not use now" valueReplace: - "true:1" - "false:0" - "active:1" - "standby:0" krbSwitch: 1 krbPrincipal: "e3base@SITECH.COM" krbKeyTab: "/etc/security/keytabs/e3base.keytab" krbUseTicketCache: "true" krbRenewTGT: "true" krbRefreshKrb5Config: "true" krbStoreKey: "false" krbIsInitiator: "true" krbDebug: "true" debug: 0启动
http_exporter代理服务。nohup /e3base/jdk/bin/java -cp collector-0.16.2-SNAPSHOT.jar io.prometheus.jmx.httpjmx.HadoopCollector 172.18.243.36:9102 httpjmx.yml 2>&1 &配置
Prometheus的配置文件。scrape_configs: # The job name is added as a label `job=<job_name>` to any timeseries scraped from this config. - job_name: "prometheus" # metrics_path defaults to '/metrics' # scheme defaults to 'http'. static_configs: - targets: ["localhost:9090"] - job_name: "namenode" static_configs: - targets: ["172.18.243.36:9102","172.18.243.36:9103"]重启
Prometheus服务,页面上出现namenode的相关数据。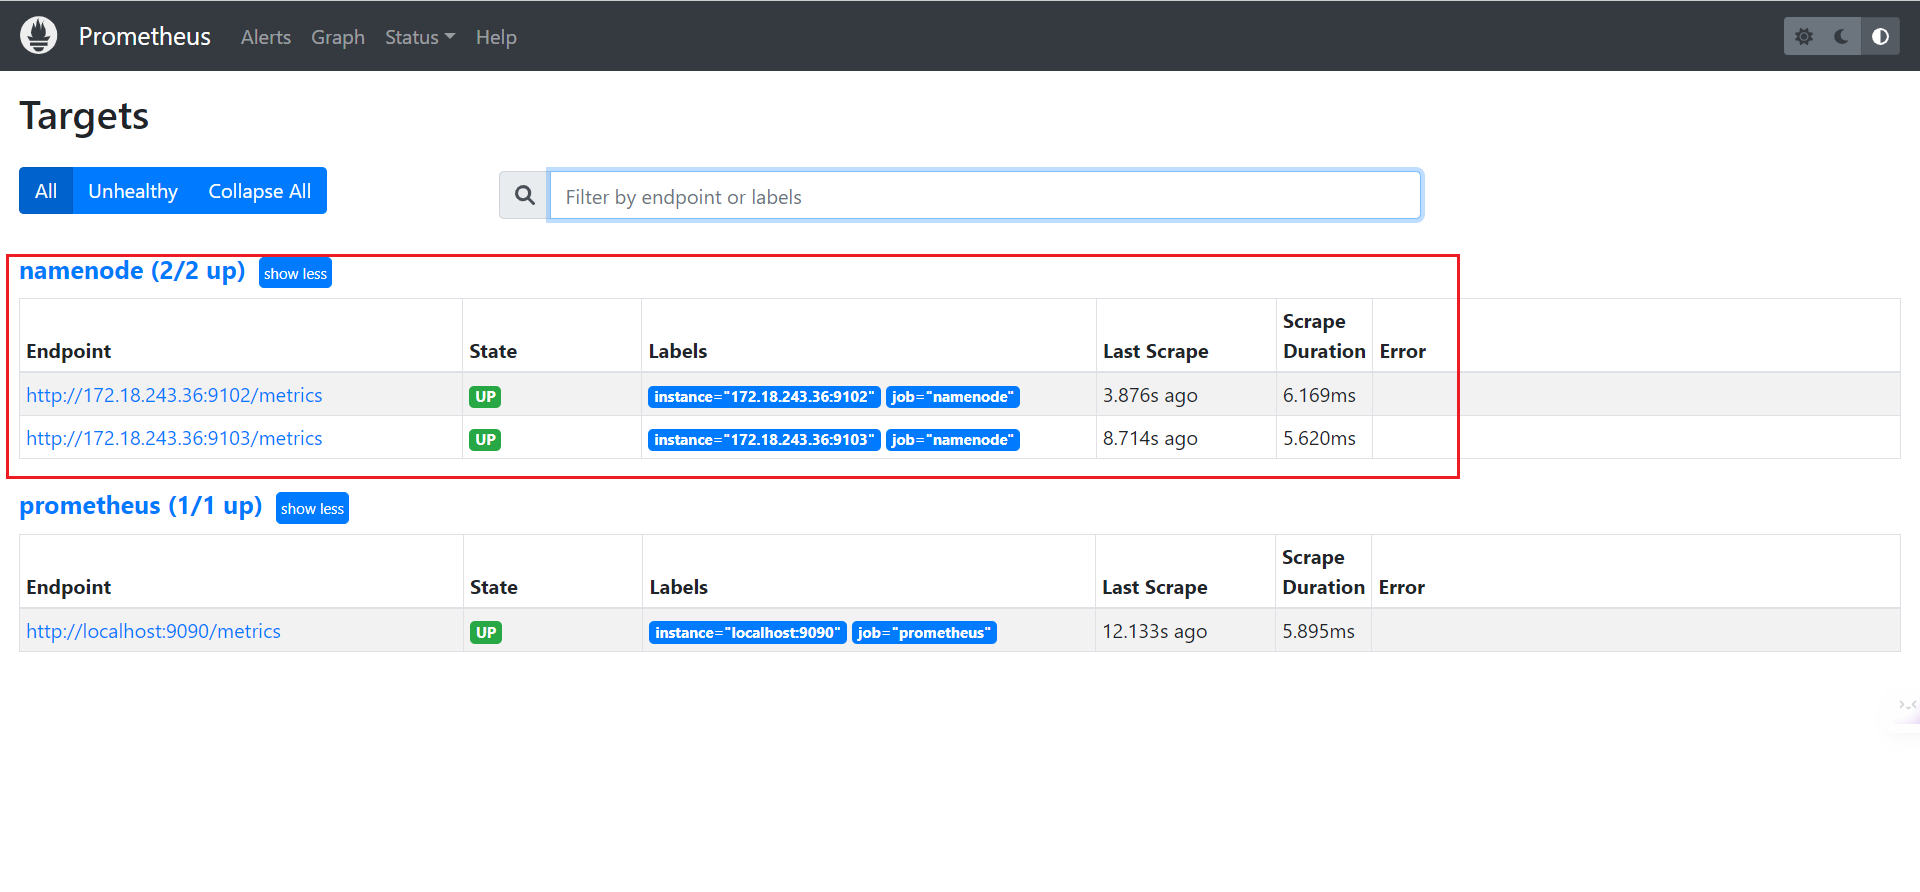
导入附件中的
namenode.json到Grafana,注意修改文件中的datasource参数,设置成Promnetheus的target名称。
导入后,页面数据正常展示。
